User research overview
During January we have been conducting a discovery phase. We have looked at what users do (search logs and analytics) and what they say (questionnaires and telephone interviews) to work out the most important solutions to design, build and test during the alpha phase.
We’ve used three main techniques:
- Data from web analytics for worldskillssaopaulo2015.com and worldskills.org - Helps to understand users, uncover usage patterns, see most popular content and use search logs to see what people are looking for.
- Web survey - Over 120 people answered the website survey in a week.
- Telephone interviews - We have conducted interviews with users from the different audiences around the world including students, teachers, participants, parents, journalists, policy makers and partners.
We’ve also talked to stakeholders at WorldSkills Abu Dhabi 2017 and WorldSkills International about what they need from the website.
Note: the analytics and the interviews focused on worldskillssaopaulo2015.com and worldskills.org, but during the survey we asked users about “WSI websites” to try to get as many people as possible to answer. When asked to specify, users referred to sites including worldskills.org, worldskillssaopaulo2015.com, worldskillsleipzig2013.com, National WorldSkills websites, euroskills.org. Information based on the survey needs to be considered with this distinction in mind.
How do users feel about the WorldSkills websites?
Many WorldSkills users found the websites “informative”, “user-friendly” and “easy to use”. Some felt they were “boring”, “frustrating” and “bland”.
Here’s some of the most common words from the survey.

You can see a bigger version here.
(Source: Survey)
Most common complaints:
- “use of ‘inside’ language”
- “It takes time to find the information I need because WSI has its own special terms”“complicated organisational structure”
- “too many websites”
- “too much information”
- “difficult to find information, particularly older information”
- “search doesn’t work very well”
- “can be overwhelming for someone who only uses it occasionally.”
(Source: Survey)
How easy was it to find what you were looking for?
Ten is very easy and one is very hard. The mean was 6.1. That’s not a bad result. Two thirds of the sample group described themselves as “WorldSkills practioners” so it’s people who already know about WorldSkills and are familiar with it.
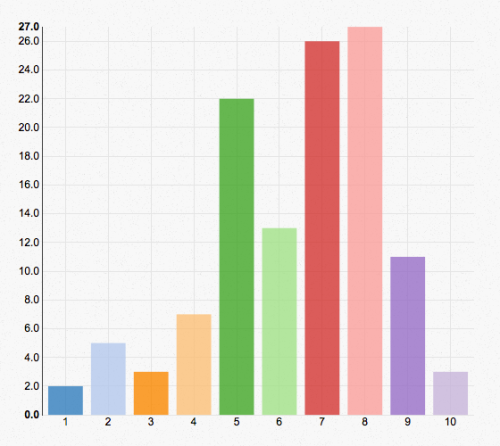
(Source: Survey)
How likely would you be to recommend the website to your friends?
Ten is very likely and one is very unlikely. The mean was 6.6, so again that’s a good result.
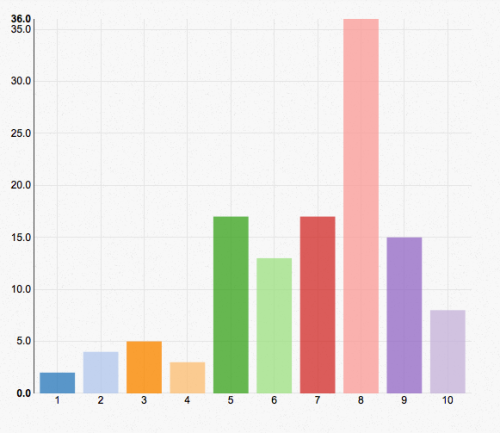
(Source: Survey)
Who are WorldSkills users?
New or returning visitors
New visitors accounted for most of the traffic (69%) with some users coming back more than once (31%). This opens up interesting questions about our approach to content: do we want to try build an audience that keeps coming back or do we try to make the most of the single visit?
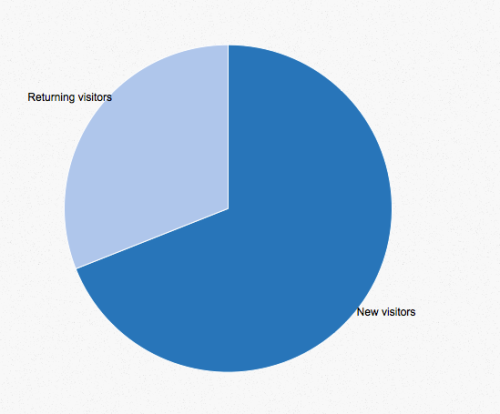
(Source: worldskillssaopaulo2015.com 20131206-20160105)
Location for worldskillssaopaulo2015.com
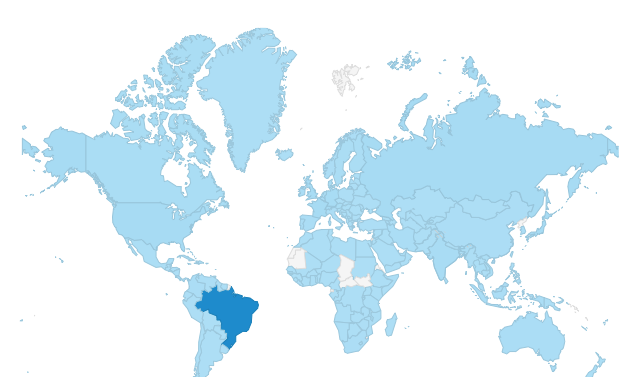
This map shows visits to worldskillssaopaulo2015.com over the two years before the event. The darker the blue, the greater the traffic. As you can see, people came from almost every country in the world, but most of the traffic came from within Brazil. This audience could be people who live in Brazil as well as people visiting from other countries for the competition.
- Brazil (62.82%)
- Japan (2.37%)
- Switzerland (2.24%)
- United States (2.18%)
- France (2.17%)
- Russia (2.13%)
- Germany (1.87%)
- United Kingdom (1.71%)
- India (1.68%)
- Canada (1.10%)
(Source: worldskillssaopaulo2015.com 20131206-20160105)
Neighbouring countries
There wasn’t much interest from neighbouring countries, though it’s difficult to predict how much this behaviour would be repeated in the context of the UAE where “local” includes many different nationalities and where a stronger bond exists across the Emirates, GCC and MENA due to a common language and shorter distances.
- Argentina - 0.08%
- Bolivia - 0.01%
- Colombia - 0.61%
- Guyana - 0.00%
- Paraguay - 0.03%
- Peru - 0.05%
- Suriname - 0.01%
- Uruguay 0.02%
- Venezuela 0.01%
(Source: worldskillssaopaulo2015.com 20131206-20160105)
Language
The local language was a bit more popular than English. Brazilian Portuguese was 55.44% and English was 44.56%. Note: many browsers in Brazil are set to pt even though people use the English site, so these figures may not be very accurate. Nevertheless this evidence supports complete translation: all content needs to be in English and Arabic.
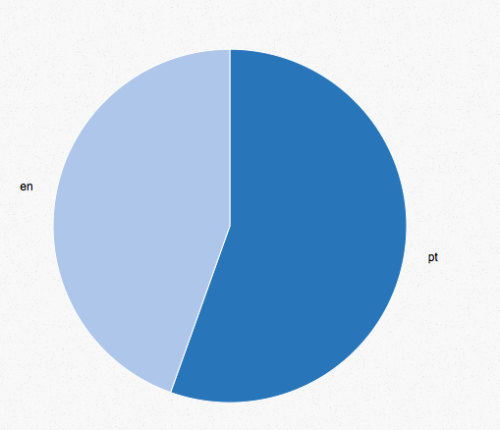
(Source: worldskillssaopaulo2015.com 20131206-20160105)
Device
Just over 40 per cent of visits came from a mobile. We expect even more visits from mobiles for this website because mobile’s share of webviews is greater in this region and there is a general trend towards increased mobile usage. All of this evidence supports a device-agnostic approach.
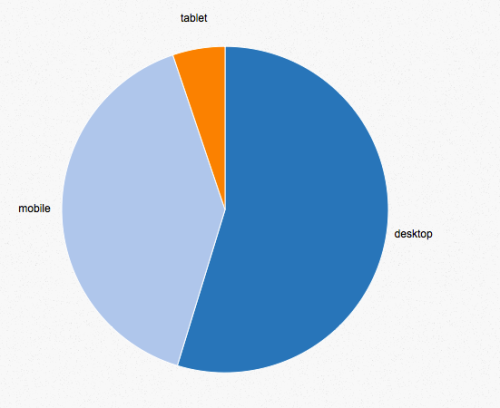
(Source: worldskillssaopaulo2015.com 20131206-20160105)
Time online
Many WorldSkills users (over 70%) live online, ie over five hours per day. They access it at home, at work and on the move. The audiences are “connected”. We just have to reach them. (Source: Survey and user interviews)
Browsers
Chrome is the most popular browser, followed by IE (IE8 gets 13% and IE7 gets 2% of IE usage but IE6 has really dropped off), Safari and then Firefox and Android.
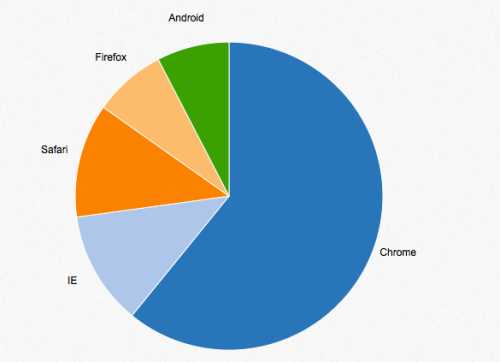
(Source: worldskillssaopaulo2015.com 20131206-20160105)
Traffic source
Most traffic comes from search or directly. Given that users go mostly to home and landing pages, it suggests search terms don’t match their queries accurately or they have general search terms. WSSP put considerable resources into digital paid-for advertising which is reflected in the fact that 20 per cent of referrals came from PPC. This raises questions about the type of engagement we consider successful: is it worth paying to draw people to the site for them to look at the homepage and leave? are we aiming for a deeper engagement from fewer users?
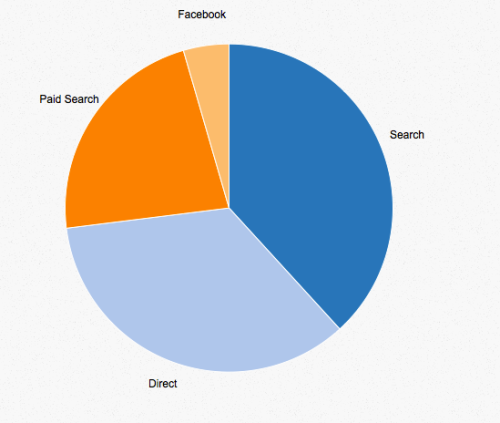
- google / organic - 36.54% - Normal search
- (direct) - 21.46% - Direct (type in url)
- google / PPC - 19.97% - Paid search
- m.facebook.com / referral - 2.14%
- facebook.com / referral- 2.10%
(Source: worldskillssaopaulo2015.com 20131206-20160105)
Social network usage
Most people use YouTube and Facebook. These figures don’t show Facebook’s dominance with certain users (such as parents) who only go online through Facebook.
- YouTube - 78.5%
- Facebook - 77.7%
- LinkedIn- 48.8%
- Twitter - 31.4%
- Instagram - 28.9%
- Flickr - 28.9%
- None of the above - 9.1%
Given the new user types we are trying to reach who live in the UAE and don’t know much if anything about WorldSkills, it makes sense for WSAD2017 to focus on Facebook. Facebook need to be the testing area for all content, ideas and experiments with tone and voice. We need to ask ourselves who will share something and why? Then we need to test it: post it to Facebook, see shares, likes and comments and use that knowledge to improve. We also need to keep in mind that a lot of users may never come to the website and only see our content within the context of a feed. How can we design for this situation and how does this influence our design decisions?
(Source: Survey and user interviews)
Top content
These are all the articles which had more than 1,000 page views. Traffic comes mostly through the home and landing layouts with big drop-offs at each interaction.
- WorldSkills São Paulo 2015 Medals and Recognition of Champions
- Press Accreditation
- Countdown for WorldSkills São Paulo 2015
- Opening and Closing Ceremonies: Two special shows!
- Ibirapuera Gymnasium venue for the Opening and Closing Ceremonies
- 12 August 2015: Future Trends
User flows
As you can see, not many specific articles received a lot of views. This could indicate problems around the navigation as well as the lack of specific interesting content.
Looking at the user flows (based on 20% of the visits), two thirds of users dropped off before their first interaction. These usage patterns raise questions about the effectiveness of digital advertising and the types of engagement we consider successful.
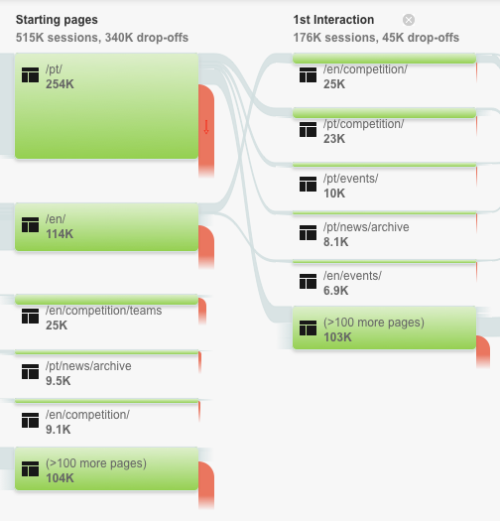
Another quarter went after the first interaction.
There was a separate, additional site for the 2015 competition at http://worldskills-experience.com/ We did not have access to the analytics for this site, but perhaps this site attracted users to specific content.
We recommend keeping the focus within http://www.worldskillsabudhabi2017.com/ It will be challenging enough to attract people to the WSAD2017 site and make people aware that it exists without diluting their attention on to another site. For the navigation, we suggest surfacing important information (rather than having packing everything under a top navigation for “competition”) to avoid making people dig.
Top YouTube videos
General explanatory videos performed well. A total of 820 videos received total views of 825,220. The top 50 videos accounted for almost half (397,000) of those views. 649 videos received less than 1,000 views. 534 videos received less than 500 views. It suggests we need to focus on producing fewer videos which get seen by more people.
- 2014-05-30 WorldSkills Sao Paulo 2015 Presentation Video - 25.8K
- 2014-10-17 WorldSkills Sao Paulo 2015 - Short Presentation Video 15.9K
- 2015-04-22 What is WorldSkills 9.3K
- 2015-08-17 Closing Ceremony (full) - WorldSkills Sao Paulo 2015 8.7K
- 2014-05-16 WorldSkills Sao Paulo 2015 8.4K
- 2015-08-21 WorldSkills Sao Paulo 2015 highlight video 7.8K
- 2015-08-14 Highlights - Day 2 4.7K
- 2014-05-19 WorldSkills Sao Paulo 2015 4.2K
- 2014-09-26 WorldSkills Sao Paulo 2015 - Presentation Video - PT-BR 4.2K
- 2015-07-02 A New Look At Skills 3.9K
- 2015-08-12 Opening Ceremony highlights from WorldSkills Sao Paulo 3.5K
- 2015-08-17 WorldSkills Abu Dhabi 2017 Preview 3.0K
- 2015-08-12 Highlights - Day 1 2.8K
Source: http://socialblade.com/youtube/user/worldskillstv and scraping YouTube
Word frequency / keywords
Search logs didn’t offer much. “Results” appeared a lot, which matches a point made in user interviews that it was difficult to find the results of the competitions.To try to discover topics of interest to WorldSkills users, we took the top 100 pages on worldskills.org and looked for keywords and word frequencies. It didn’t really show anything interesting or surprising, but “career skills explained” and “media news” emerged as the most important keywords supporting the idea of focusing on skills and their connection to the world.
The full list is available here.
Results of this work
This overview has confirmed various principles around things like a device agnostic approach and translation. We have a list of user needs along with some personas for important types of users which we will be publishing soon.We will also be talking about what this analysis means in the context of designing, building and testing solutions in the coming weeks during the alpha phase. Thanks for reading!