Project aims and measures of success
In big projects it’s all too easy to lose sight of why we are doing them and what we want to achieve. Let’s explore some of the important goals, outcomes and metrics for the WorldSkills Abu Dhabi 2017 web project, which have emerged during the discovery and alpha phases, in particular how we are putting metrics at the heart of all our work.
Outcomes - What are the top things we want a user to do?
SMART objectives - Specific, Measurable, Achievable, Relevant and Time-bound - are a good starting point to think about goals with the emphasis on being specific and measurable. Most of the points below are specific and measurable, but some such as “tell their friends” and “learn about WorldSkills” are a bit more difficult to measure. We will continue to develop these objectives and ways of measuring if we are achieving them through the project.
- Subscribe to our newsletter
- Subscribe to social feeds
- Come back for more - encourage repeat visits
- Tell their friends
- Learn about WorldSkills and understand the competition
- Access information about vocational training
What stories do we want them to tell to their friends?
These are the core messages that we want people to understand, the stories we want people to tell their friends about and the ideas we want others to spread through their networks.
- How vocational skills and education can change your life.
- The competition is a first for the Middle East.
- Vocational skills are fundamental for economic diversification and vocational education is vital for Abu Dhabi’s future.
- Abu Dhabi is a world-class venue for major international events.
Metrics and measures of success
How do we know we are achieving what we want to achieve? Inspired by gov.uk’s info pages, we decided to experiment with an approach that brought important metrics to the page rather than making staff go off and look for those figures in different places. Our first version is available at the bottom of each page on the preview site. (It won’t be at the bottom of the page on the live site, but it will be accessible either from with Concrete5 or by adding something to the page url.)
We went over the most important metrics and wrote accompanying text to explain what they mean and how to use them. The main aim is to start to instill a metrics-based approach to content for the new site. Here’s how it looks right now:
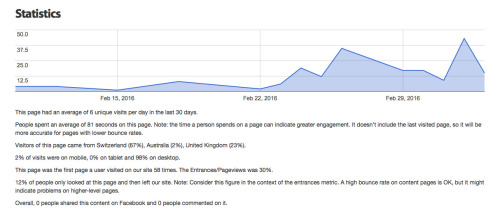
The graph shows unique pageviews over the last 30 days. Below it pulls in some important metrics from Google Analytics. The figures include explanatory text to help people understand the metrics and highlight things to be aware of, such as how the time on page figures doesn’t include the last visited page, so it is more accurate for pages with a lower bounce rate.
We’ve also pulled in data from Facebook about how many users shared this content on Facebook and how many users commented on it. Later we might include how many people shared and liked the content within 12 or 24 hours of publishing - attempting to capture a simple version of the “velocity” of a piece of content in the network. In the future we will also pull in data from other networks such as Twitter. We are also working on an overview dashboard that will provide a high-level view on these metrics as well as other data such as newsletter subscribers.
We are also considering pulling in the user needs for a particular layout and displaying them here as well. By linking a user need to the live item that fulfills the need, we hope to keep users at the heart of our approach and to keep the work of the discovery phase at the centre of the project.
This is just the beginning. We’ll be working on the objectives throughout the project as well as developing what is worth measuring and how effective it is. We hope this gives you a glimpse of how we are putting metrics at the heart of everything we do. In particular, we hope this approach will help the team to see what works and what doesn’t work and do more of what works and avoid what doesn’t work. It sounds simple, but we think this experimental approach - in the sense of always experimenting, revising and improving what we do in response to data - is the best approach to making successful media right now.